Preterm Birth and SIDS

Longer gestation in weeks increases the infants’ weight and decreases the risk of SIDS
| Table 1: Preterm births (internal variable = sigma) | |
| Gestation (GA) | Sigma |
| 24–27 weeks | 0.5 |
| 28–31 weeks | 1.0 |
| 32–33 weeks | 2.0 |
| 34–36 weeks | 3.0 |
| 37–38 weeks | 4.0 |
A theoretical model can provide an analytical way to determine the risk of SIDS, for varying gestation times in weeks. A sigma value of 0.5 corresponds to a gestation time of 24 to 27 weeks and has a higher SIDS risk value, than a sigma value of 4.0, which corresponds
to a gestation time of 37 to 38 weeks. Longer gestation times helps to increase the infants’ weight and helps to decreases the risk of SIDS.
The equation below uses the natural log function (e), to estimate a SIDS probability distribution curve for varying gestation times in weeks.
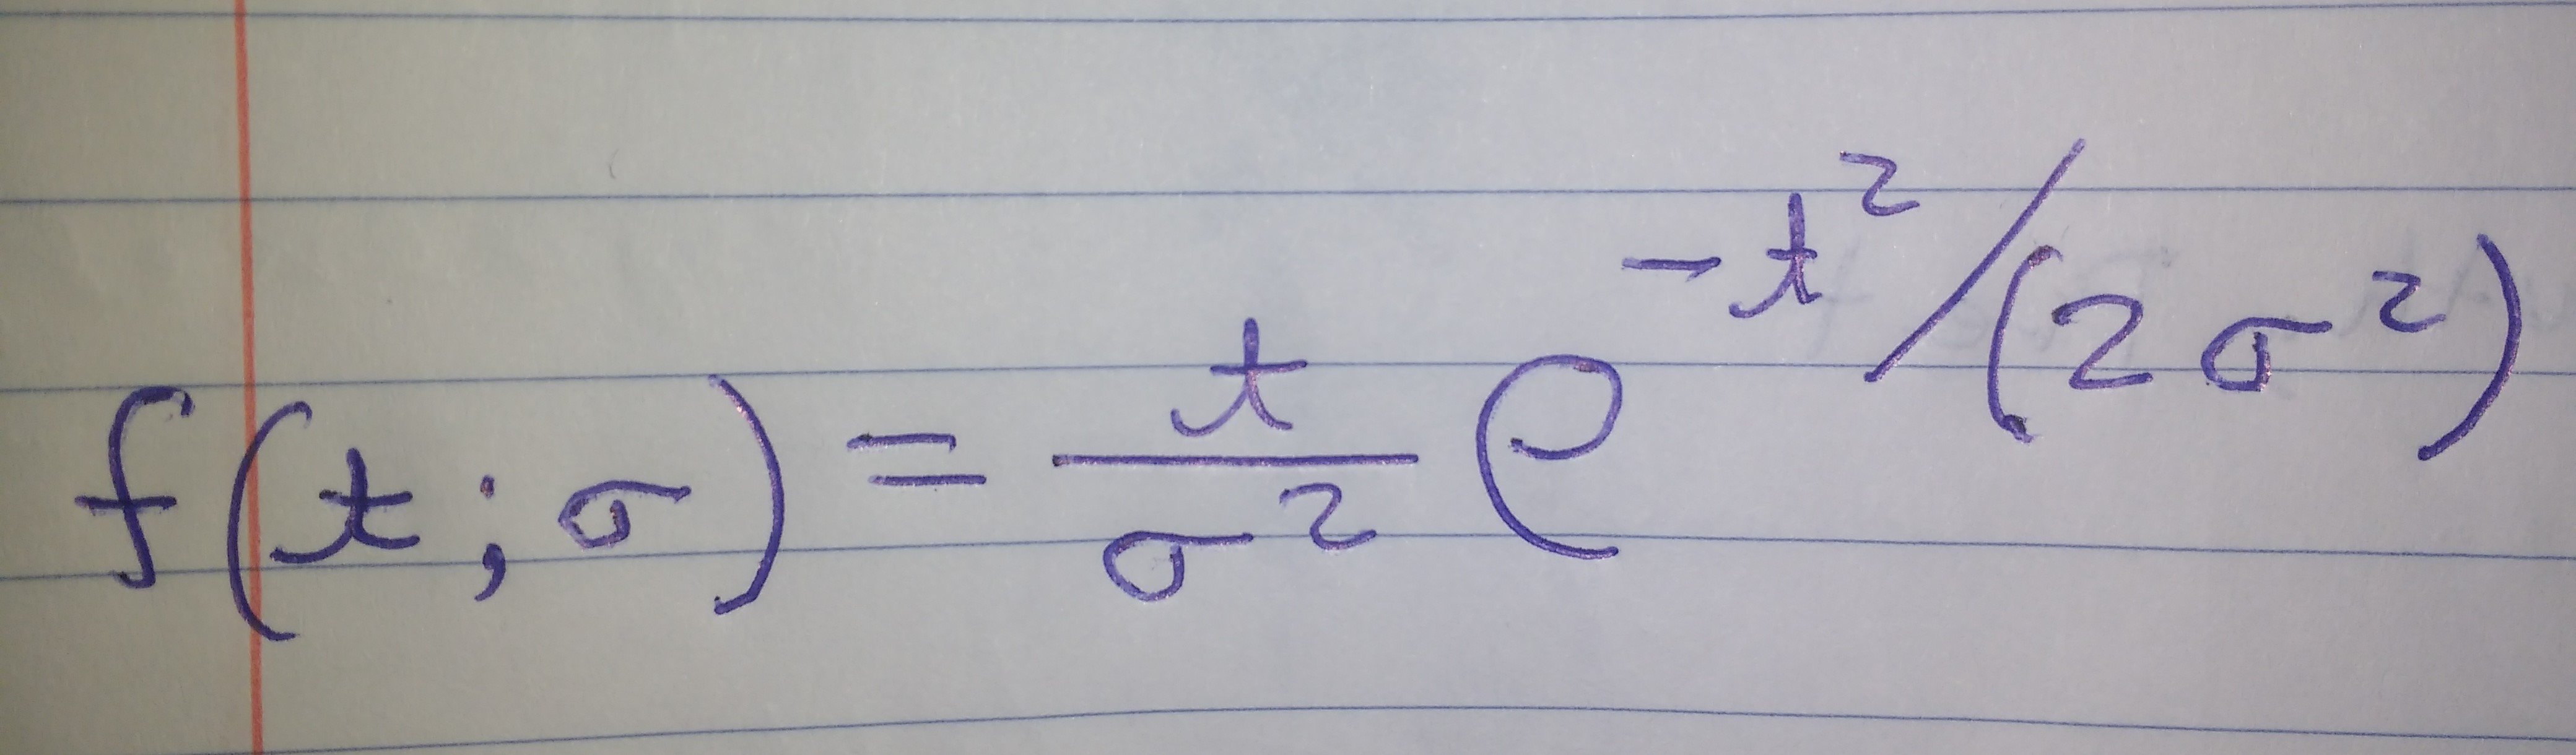
is the function with variables
(time in months) and
Published journals cite about 90% SIDS deaths occur within the first six (6) months of life.
“…..there were consistent positive correlations between the HRV parameters and birth weight (RMSSD: P = 0.001; PNN50: P = 0.001; HF: P = 0.002). To determine the effect of birth weight on HRV parameters, we perform multivariate linear regression analysis adjusted for potentially confounding factors (prematurity, gender, age, BMI, physical activity index and SBP levels). These findings were preserved even after adjusting for these confounders. Our results suggested that impaired cardiac autonomic modulation characterized by a reduction in the parasympathetic activity occurs in children with low birth weight.”
Cited: Souza LV, Oliveira V, De Meneck F, Grotti Clemente AP, Strufaldi MW, Franco MD. Birth Weight and Its Relationship with the Cardiac Autonomic Balance in Healthy Children. PLoS One. 2017;12(1):e0167328. Published 2017 Jan 17. doi:10.1371/journal.pone.0167328
The graph below shows the results of how a SIDS probability distribution graph would look like, when plotted with numeric values for different gestation time in weeks. Sigma values range from 0.5 (lower birth weight) to 4.0 (higher birth weight).
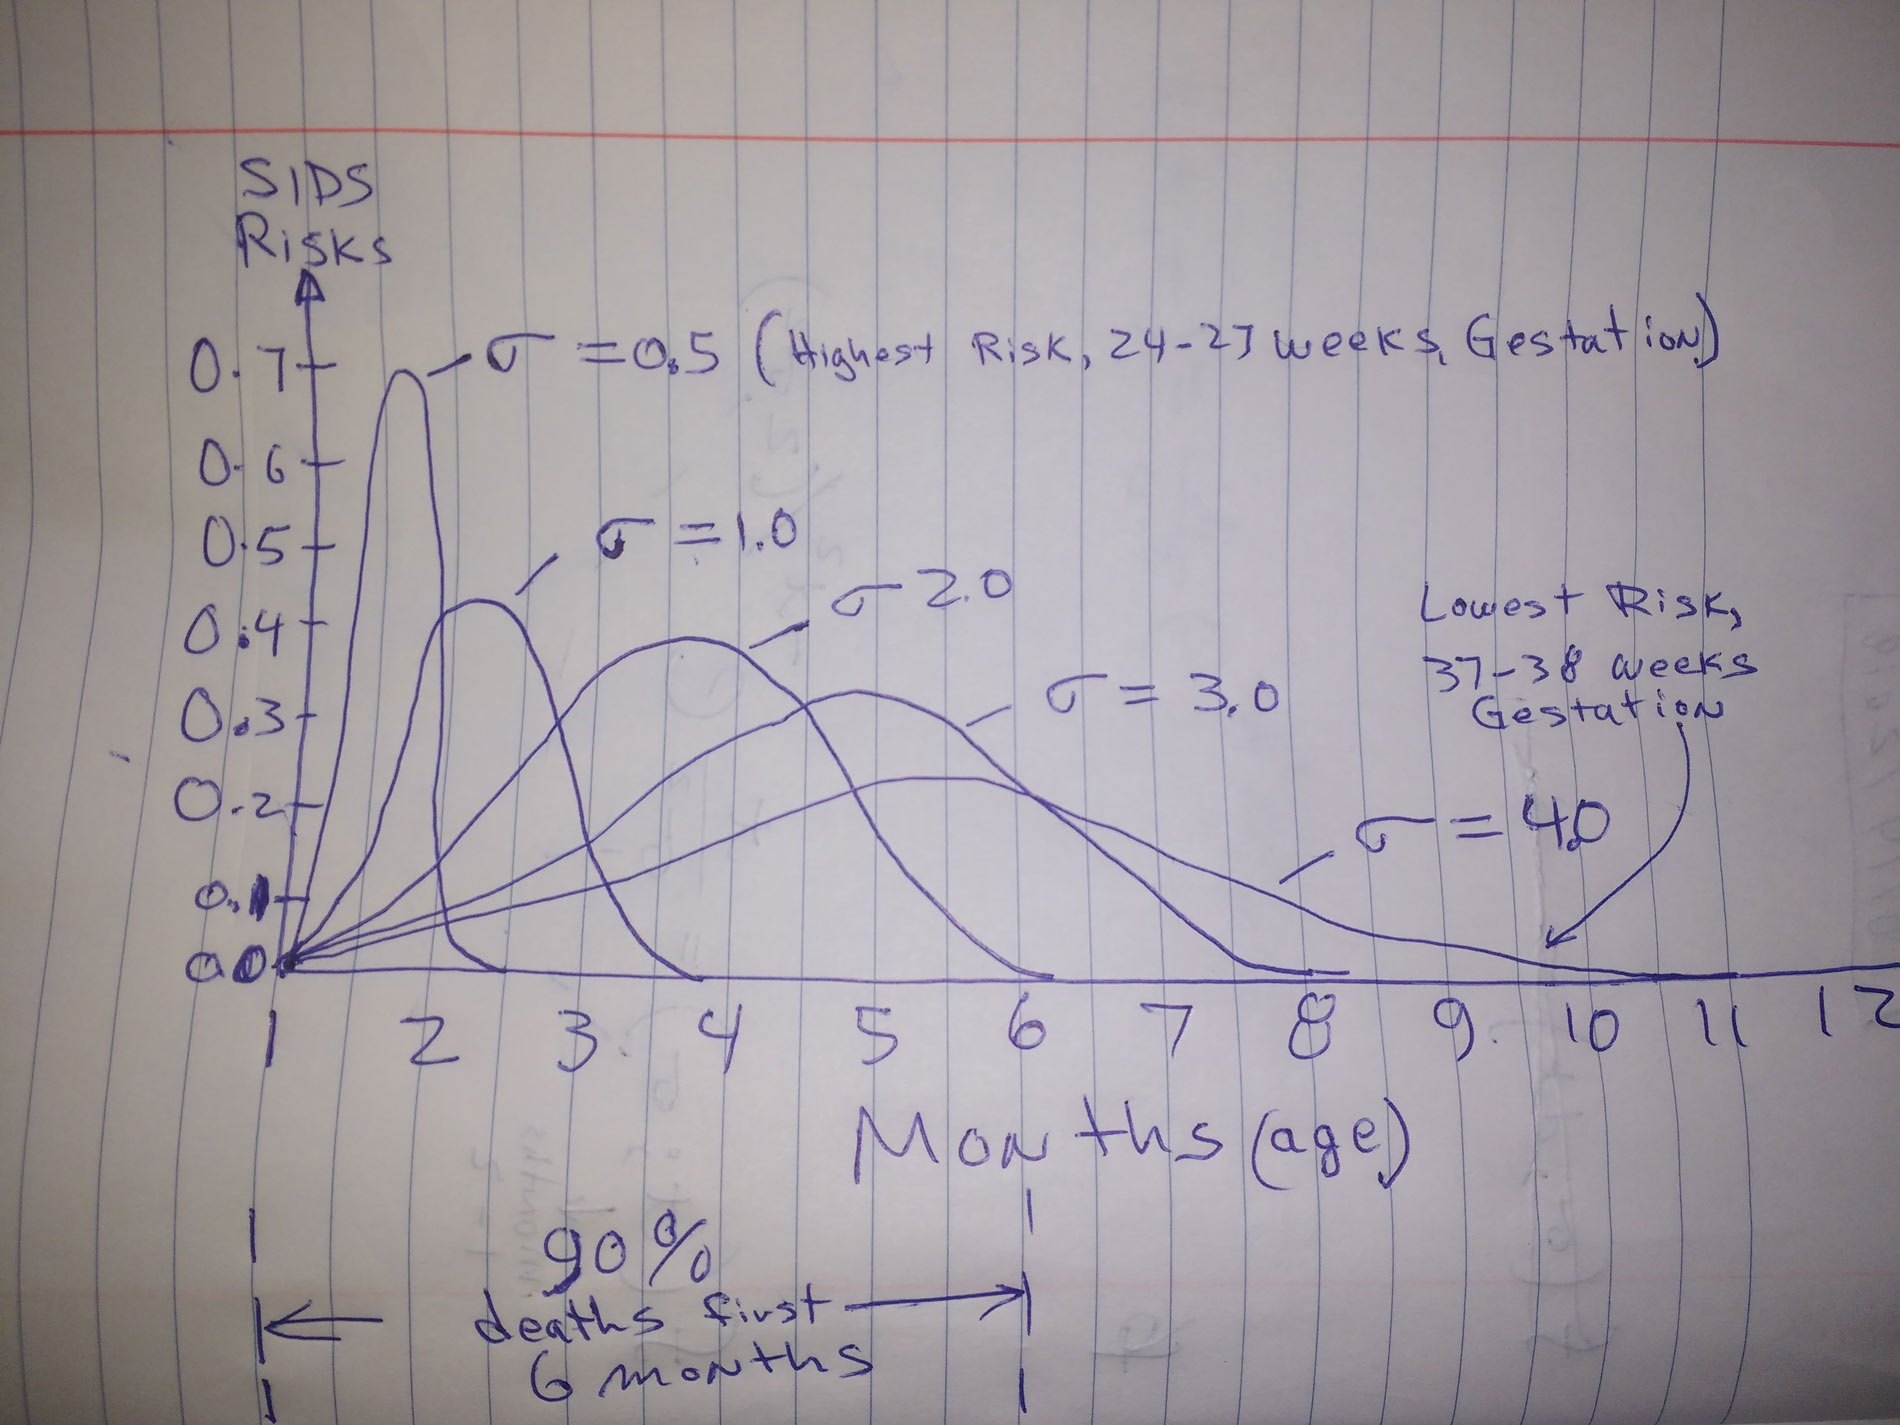
Graph: SIDS probability distribution for varying gestation time in weeks
- The horizonal axis is the age of the infant in months, 1-12 months.
- The vertical axis is the SIDS probability distribution (unitless).