SIDS: Geolocation and Time of Year
Clearly, after over fifty years of SIDS research -a major paradigm shift in our way of thinking about SIDS is needed to solve this enigmatic and elusive killer. This study provides 19 years of data-based evidence that shows statistically significant correlations of distinct patterns between SIDS deaths and varying levels of geomagnetic energy are correlated with the time of year and on geographic location. The data clearly shows that geographic location and time of year have a relationship with a decrease in SIDS deaths, that associated an increase in geomagnetic energy. The extremely low frequencies -especially the 12-14 Hz frequencies strongly suggest that the highest risk of SIDS deaths may be happen during stage 2 of the Non-REM (Non Rapid Eye Movement) sleep cycle. These correlations, strongly support a potential causal beneficial effect on the infant's autonomous nervous system, which reduces the incidents of SIDS.
Schumann Resonance and Geomagnetic Energy and Lightning Flashes
NASA estimates 44 lightning strikes per second hit the earth. Each Lightning strike releases about 1,000,000,000 (1 billion) joules of energy. The Ultra-Low Frequencies (ULF) of lightning have long wavelengths and travel thousands of kilometers in all directions. Most lightning flashes consists of a multitude of cloud to ground strokes. The average duration of a stroke is 30 milliseconds (References #, #) , however due to limitations of the human eye, only one flash is visible.
The electromagnetic energy released from lighting flashes has an electric vector (Volts-Joules) and a magnetic vector (Amps-Tesla) refer #. The geomagnetic energy for this study, derives magnetic energy implicitly by inference from the electric vector of lightning flashes.
The physics of wave propagation results in longer wavelengths for lower frequencies and shorter wavelengths for higher frequencies. The earth’s ionosphere plays an important role in the path and distance traveled by the magnetic energy generated by lightning due the reflecting nature of the highly polarized and dense ionic plasma within the ionosphere.
Some commercial and military communications radio systems use the reflective nature of the ionosphere to transmit radio waves at thousands of kilometers around the earth. Since lower frequencies have longer wavelengths, the preferred frequencies to bounce signals using the ionosphere are the lower frequencies. The higher frequencies are absorbed by the dense ionic plasma within the ionosphere or penetrate the ionosphere and travel out to space.
The ionosphere starts at about 85 Km and extends to about 1000 Km above the earth. The electromagnetic energy from lightning gets trapped between the ionosphere and the surface of the earth. Geomagnetic energy (except for the magnetic field which is generated from the iron core deep in the earth), is a result of lightning magnetic energy that is trapped between the ionosphere and the surface of the earth. Standing waves are formed around the earth with frequencies known as Schuman Resonance frequencies.
Click the link below for a YouTube video to learn more about Schuman Resonace:

The seasonal phenomena associated with SIDS is inversely correlated to natural atmospheric noise from Lightning. A single lightning strike produces billions of watts of power and generates electromagnetic power worldwide. The electromagnetic power can be heard as static on any AM radio. This natural static noise is the overlooked Exogenous factor in SIDS. Natural noise interacts with the human biophysically and affects heart rate variability.
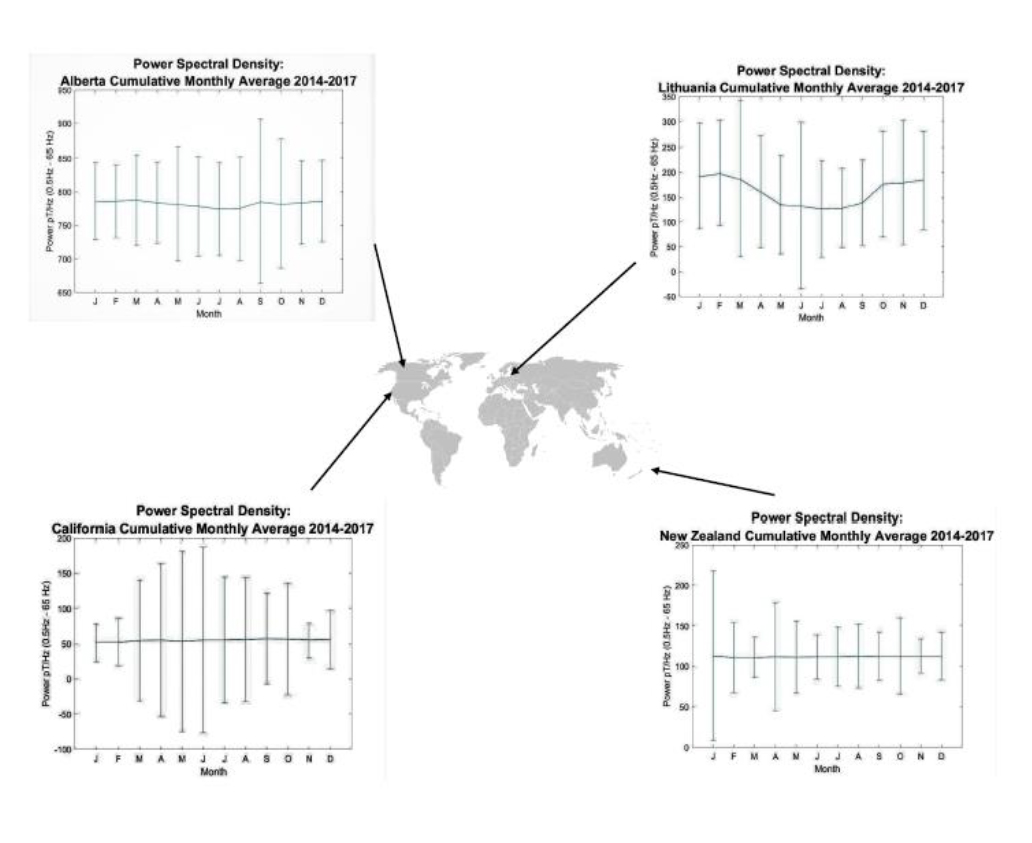
Geomagnetic data was collected from ground stations in California, Lithuania, Alberta Canada and New Zealand during the years from 2014 to 2017. The intensity (or amplitude), of the geomagnetic signals, is a result of global lightning strikes, which according to NASA satellite imagery, strike the earth about 44 times per second. Additionally, due to the reflective characteristics of the ionosphere, the electromagnetic power of lightning strikes, can travel thousands of miles around the earth, bouncing between the earth’s ground surface and the ionosphere, especially for frequencies below 300 Hz, with little or no attenuation. The intensity (or amplitude), of the signals is called, Power Spectral Density (PSD).
The graph below shows the Power Spectral Density for different geographic locations.
